
Compares places at one point in time.
A score of 120 means the modeled basket costs about 20% more than the London reference. It describes relative price levels across cities.
Cost of living index
Search and sort monthly budgets across 250 major cities, then learn what an index can and cannot tell you.
September 2026 · USD equivalent · one person · balanced lifestyle
Showing 1–25 of 250 matching cities · 250 total
| Rank | City | Cost index | Monthly model | Housing | Guide |
|---|---|---|---|---|---|
| 01 | San FranciscoCalifornia, United States | 127 | $5,100 | 65% | View |
| 02 | New YorkNew York, United States | 126 | $5,040 | 63% | View |
| 03 | ZugSwitzerland | 126 | $5,050 | 55% | View |
| 04 | ZurichSwitzerland | 120 | $4,780 | 52% | View |
| 05 | GenevaSwitzerland | 116 | $4,650 | 55% | View |
| 06 | San JoseCalifornia, United States | 113 | $4,500 | 67% | View |
| 07 | OaklandCalifornia, United States | 113 | $4,500 | 62% | View |
| 08 | Jersey CityNew Jersey, United States | 112 | $4,460 | 65% | View |
| 09 | BaselSwitzerland | 112 | $4,480 | 49% | View |
| 10 | LausanneSwitzerland | 112 | $4,480 | 51% | View |
| 11 | BostonMassachusetts, United States | 110 | $4,410 | 61% | View |
| 12 | HonoluluHawaii, United States | 110 | $4,390 | 57% | View |
| 13 | Los AngelesCalifornia, United States | 103 | $4,140 | 60% | View |
| 14 | San DiegoCalifornia, United States | 103 | $4,140 | 63% | View |
| 15 | BernSwitzerland | 102 | $4,100 | 49% | View |
| 16 | Washington, DCDistrict of Columbia, United States | 101 | $4,040 | 59% | View |
| 17 | LondonUnited Kingdom | 100 | $4,000 | 57% | View |
| 18 | AnaheimCalifornia, United States | 100 | $4,000 | 60% | View |
| 19 | SingaporeSingapore | 100 | $3,980 | 63% | View |
| 20 | SeattleWashington, United States | 99 | $3,940 | 56% | View |
| 21 | Hong KongHong Kong | 99 | $3,970 | 63% | View |
| 22 | Tel AvivIsrael | 98 | $3,920 | 54% | View |
| 23 | DubaiUnited Arab Emirates | 97 | $3,860 | 57% | View |
| 24 | MiamiFlorida, United States | 97 | $3,860 | 60% | View |
| 25 | LuxembourgLuxembourg | 97 | $3,890 | 57% | View |
London = 100 · One person · Balanced lifestyle · USD-equivalent estimates
City directory
Open a server-rendered guide for the full budget, category detail and planning assumptions.
Read the measure correctly
A score of 120 means the modeled basket costs about 20% more than the London reference. It describes relative price levels across cities.
Measures such as CPI show whether a basket becomes more expensive over months or years. They answer a different question.
How to read the score
Here, London is set to 100. A city at 120 has a modeled basket 20% above the London reference under the same assumptions.
An index weighted toward housing can differ sharply from one centered on groceries or a car-free household.
A national, metropolitan and city-level estimate can describe different areas. None should be silently relabeled as a neighborhood price.
A reference-currency total can change because the currency moved even when local rent and groceries did not.
Direction matters
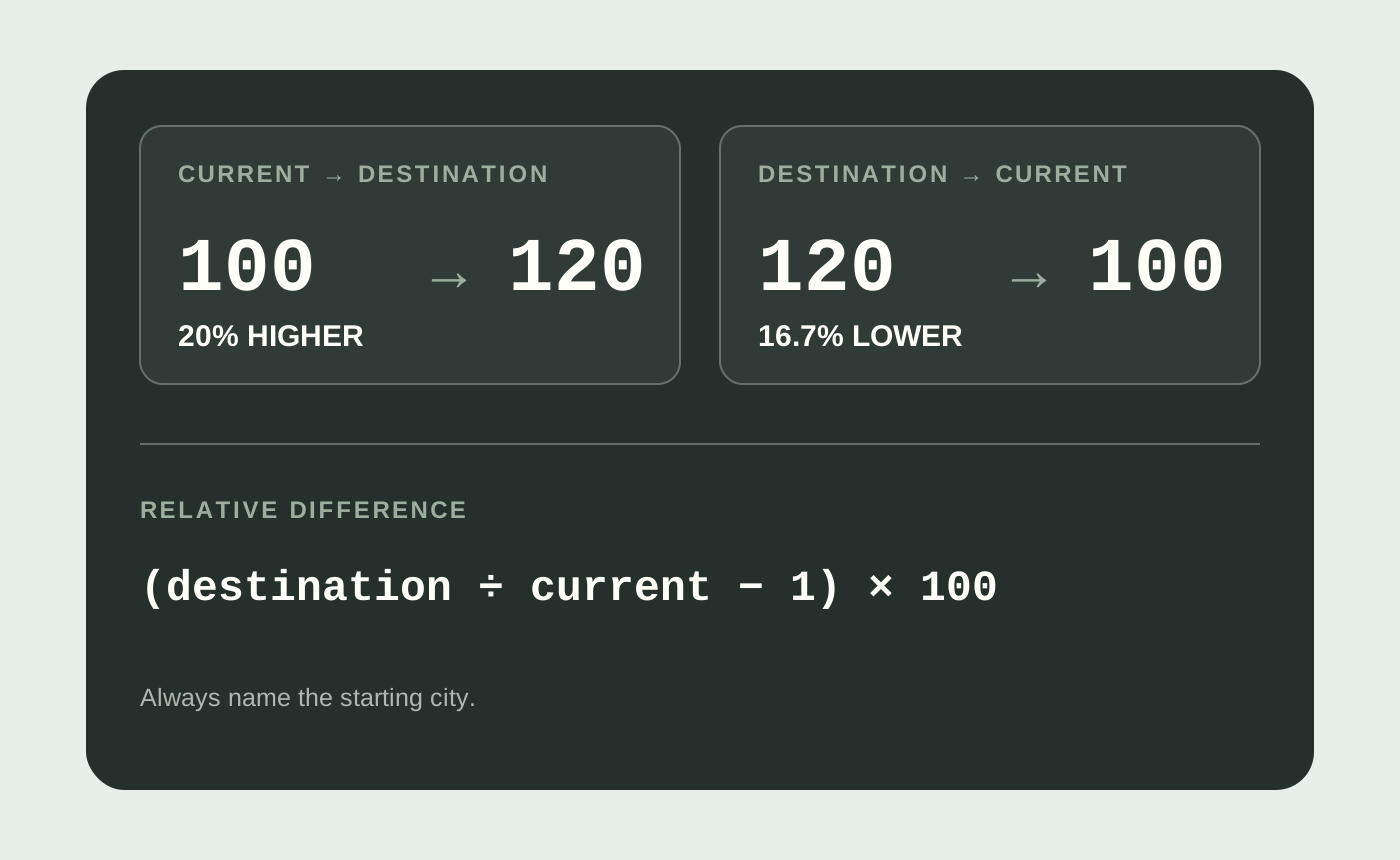
Moving from an index of 100 to 120 is a 20% increase. Moving from 120 to 100 is about a 16.7% decrease because the starting value, or denominator, has changed.
Neighborhood choice, household needs, exchange rates and data freshness can matter more than a few index points.
All cities use the same 16 categories and household assumptions so the comparison remains interpretable.